Cost To Collect Revenue Cycle Benchmarks: How To Maintain A Healthy Revenue in Healthcare
Learn what cost-to-collect benchmarks mean for your RCM, how to calculate and track it, and how AI can help you hit the 2% industry standard.
April 7, 2026


Key Takeaways:
• Cost-to-collect (CTC) measures how much a healthcare organization spends to collect every dollar it has already earned—expressed as a percentage of net collections. The lower the number, the more efficient the revenue cycle.
• HFMA's best-practice benchmark for hospital CTC has dropped from 3% to 2% over the past five to seven years. And the gap between those two numbers is millions in avoidable annual cost.
• A rising CTC is almost always traced back to the same root causes, such as high denial rates, manual billing and coding workflows, slow AR follow-up, and technology that is not delivering efficiency at scale.
• Reducing CTC requires eliminating the manual touchpoints that generate the most—rework, documentation, coding, billing, denial management, and appeals.
Hospitals and health systems are spending a fortune at every stage of the revenue cycle. Billing and collections alone account for an estimated $40 billion in annual spend.
On top of that, private payers deny 15% of all claims on first submission, pushing a significant portion of claims into rework cycles that billing teams absorb every single week.
These administrative workloads, rework costs, and other revenue cycle expenses increase the cost required to collect revenue.
When cost-to-collect goes untracked, inefficiencies accumulate silently. By the time the number surfaces in a financial report, the damage is already done.
But when you know your CTC, what the industry benchmarks are, and the factors that inflate it, you have a clear roadmap for where to intervene.
This guide walks through everything—what cost-to-collect is, how to calculate and track it, what the industry benchmarks mean in practice, and how AI-powered automation is helping organizations hit best-practice targets that were difficult to reach.
What is Cost-to-Collect in Healthcare Revenue Cycle?
Cost-to-Collect (CTC) is a key revenue cycle performance benchmark that measures the total operational cost a healthcare organization incurs to collect one dollar of net patient revenue.
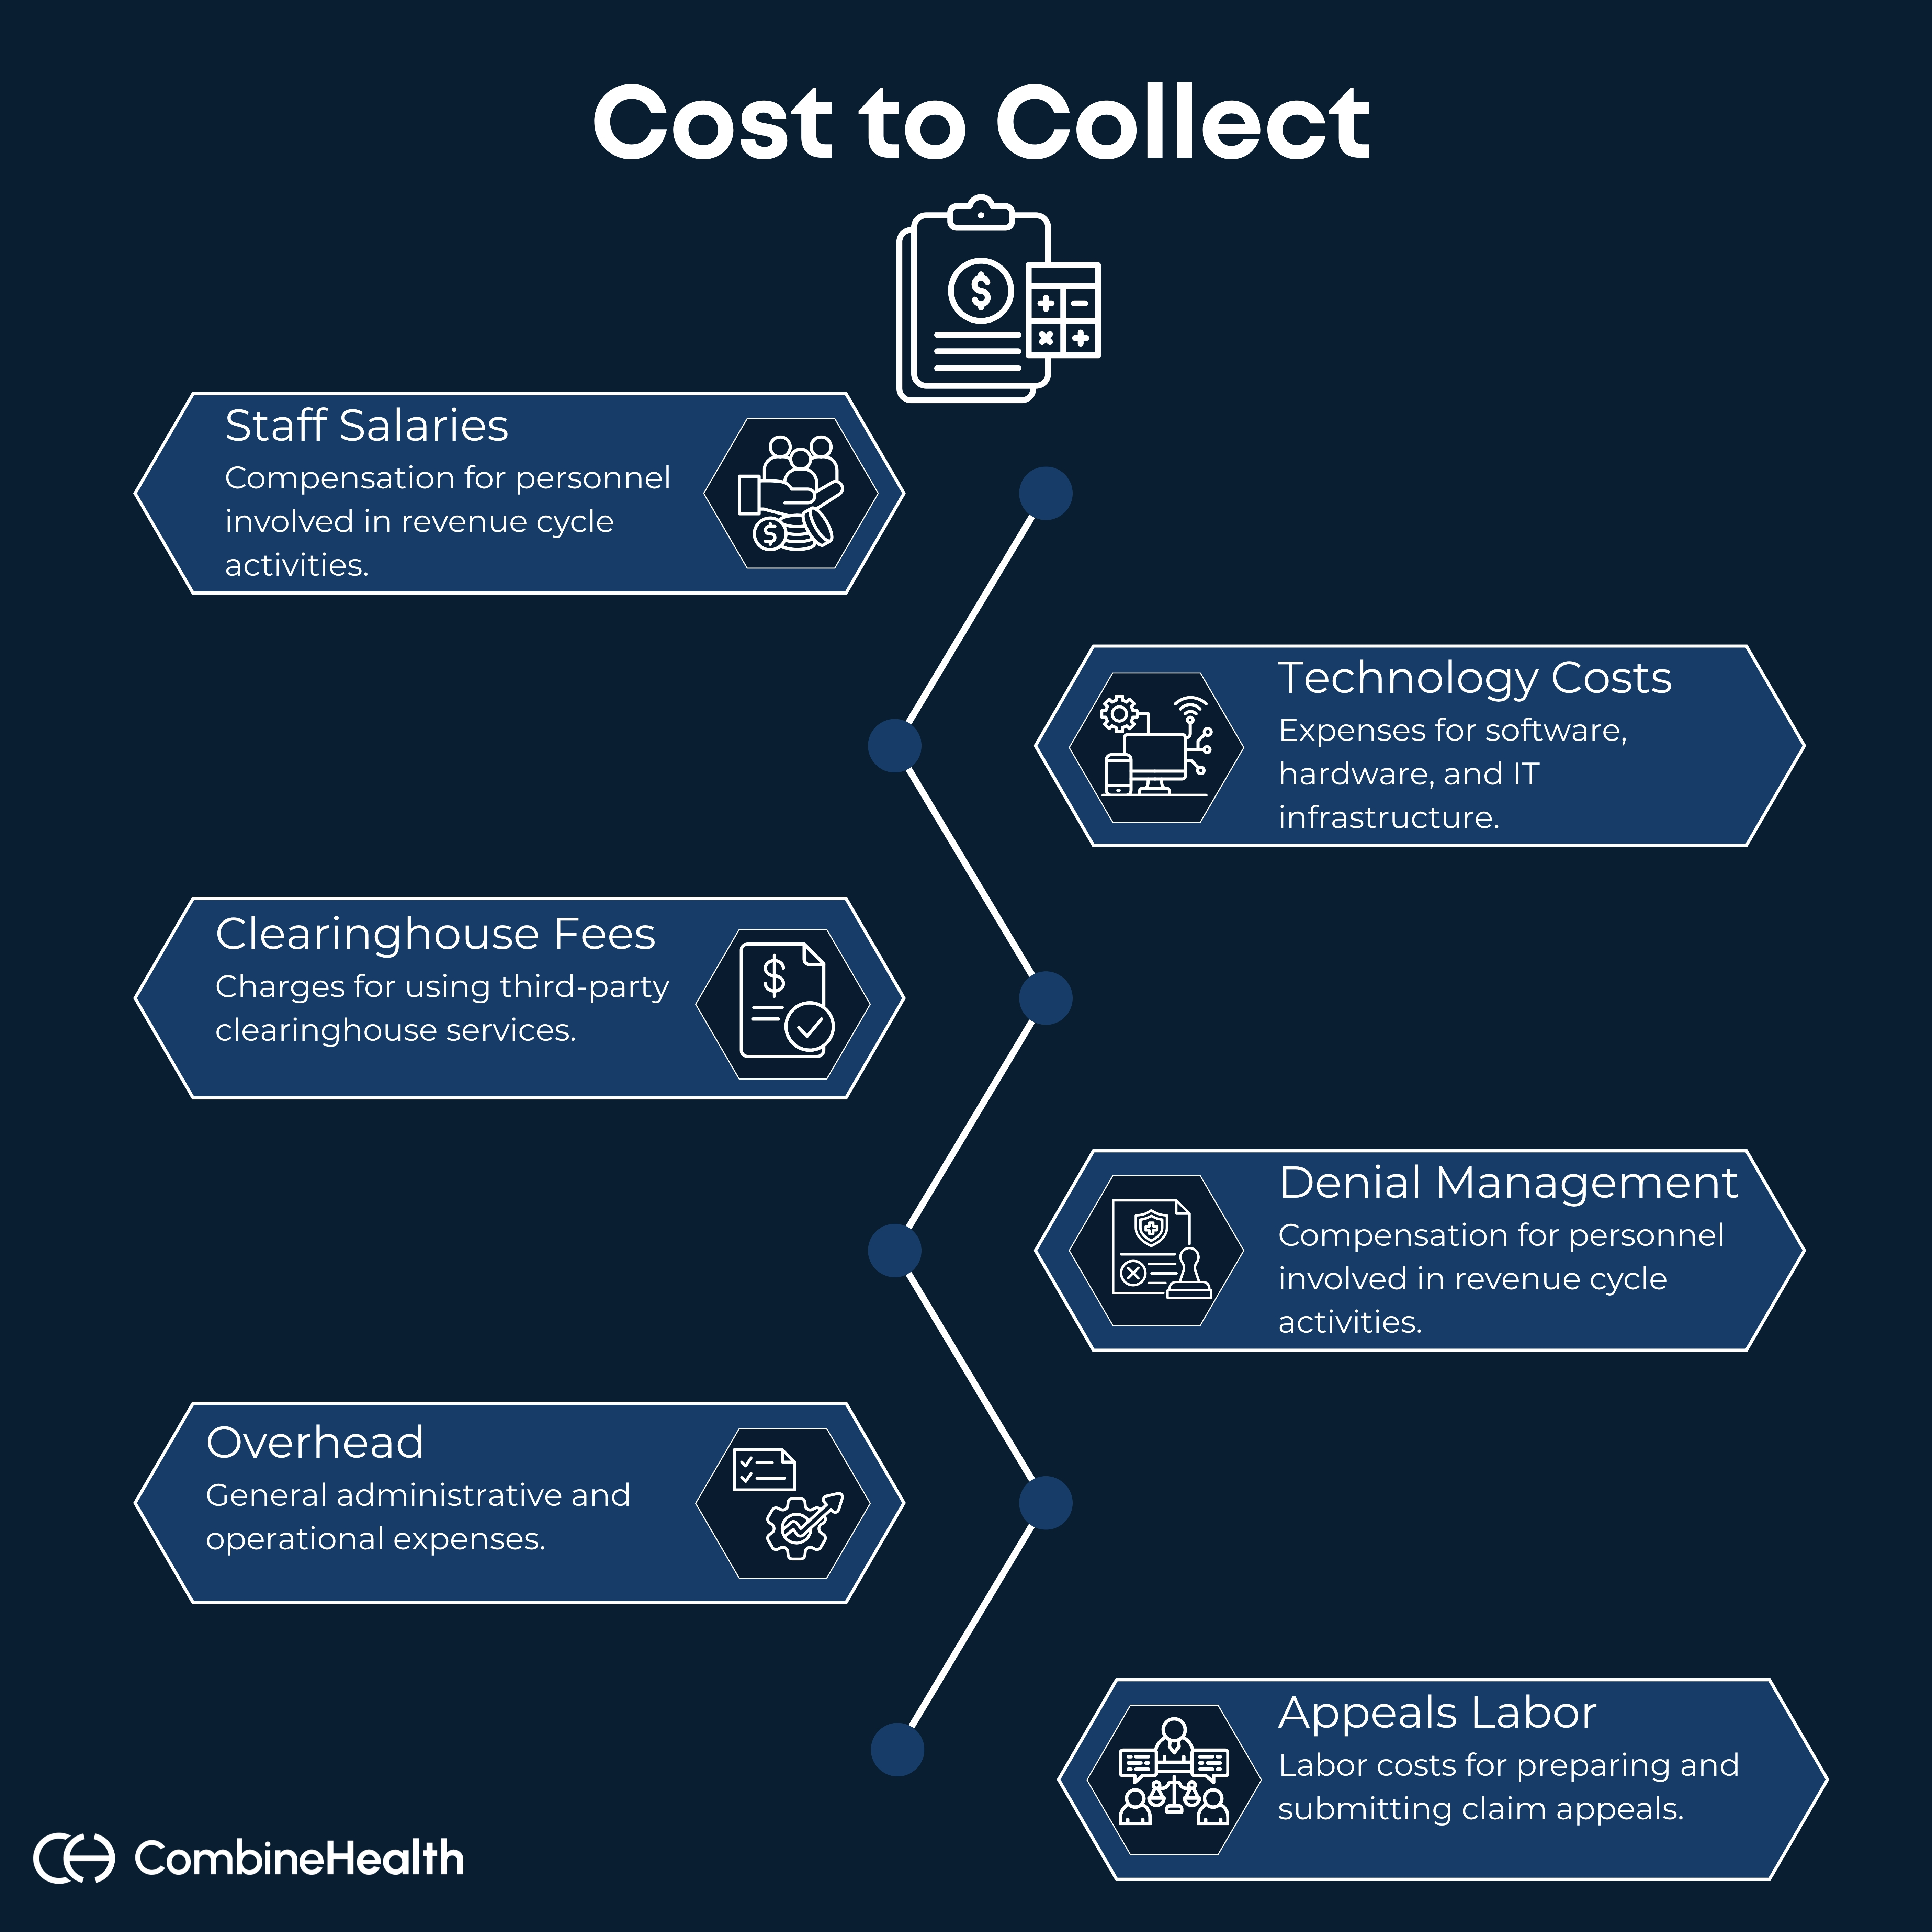
It captures every expense tied to the revenue cycle, such as:
- Staff salaries
- Technology costs
- Clearinghouse fees
- Denial management
- Appeals labor
- Overhead
It expresses that total as a percentage of net collections.
To put this into a scenario, let’s say a mid-sized hospital system collects $150 million in net patient revenue annually. At a 3% CTC, that organization is spending $4.5 million a year just to collect what it is already owed. If that same hospital brings its CTC down to the 2%, it recovers $1.5 million in operational cost, without seeing a single additional patient.
That $1.5 million is the direct result of fewer denied claims, less manual rework, and billing workflows that run cleaner the first time.
Why Knowing Your Cost-to-Collect Benchmark Matters in Revenue Cycle
Cost-to-collect is one of the key RCM metrics that healthcare leaders should track consistently, alongside days in AR, denial rates, and first-pass acceptance rates. Think of it as a diagnostic tool rather than just a metric.
A rising cost-to-collect number tells you something in the revenue cycle is generating unnecessary cost, whether that is rework from claim denials, excess labour in manual billing workflows, or technology that isn’t delivering efficiency at scale.
Knowing where your cost-to-collect stands relative to industry standards helps RCM leaders do three things:
1. Identifying Where the Revenue Cycle is Inefficient
A CTC trending above the industry benchmark almost points to a specific bottleneck(s)—elevated denial rates, slow AR follow-up, or coding errors that compound before anyone catches them. The benchmark gives you a reference point to start asking the right questions.
2. Evaluating Technology ROI Accurately
If you have deployed an RCM tool that is not moving the CTC benchmark in the right direction, it is not delivering the real value. CTC is one of the clearest ways to measure whether an investment is actually working.
3. Setting Defensible Performance Targets
Cost-To-Collect revenue cycle benchmark data gives finance teams and RCM leadership a shared, measurable goal—one that is grounded in what high-performing organizations are actually achieving.
What is the Industry Benchmark for Cost-to-Collect in Healthcare?
According to HFMA (the most widely referenced source for revenue cycle management benchmarks), the industry best practice cost to collect in hospitals has fallen from approximately 3% to 2% over the prior 5 to 7 years.
This decline is largely attributed to productivity gains from revenue cycle automation tools, which allow organizations to handle higher claim volumes without proportionally increasing staff or operational costs.
Here's what the different costs-to-collect levels mean in practice:
How to Calculate Cost-to-Collect in Revenue Cycle Management?
HFMA, the body that establishes revenue cycle benchmarking standards for healthcare organizations across the US, outlines it this way:
Now let's take a look at what each part of the equation means:
Total Revenue Cycle Cost:
- Salaries and fringe benefits for patient access, HIM, coding, billing, cash posting, collections, and denial review staff
- Management vendor and outsourcing fees
- Software subscriptions and clearinghouse fees
- Transaction and contingency fees
- Legal fees related to billing and payer disputes
- Record storage and office overhead
Total Patient Service Cash Collected:
- All payments posted to patient accounts from insurance payers and patients
- Undistributed payments and bad debt recoveries
- Medicare DSH and IME payments
How to Track Cost-to-Collect Benchmark for Your Organization?
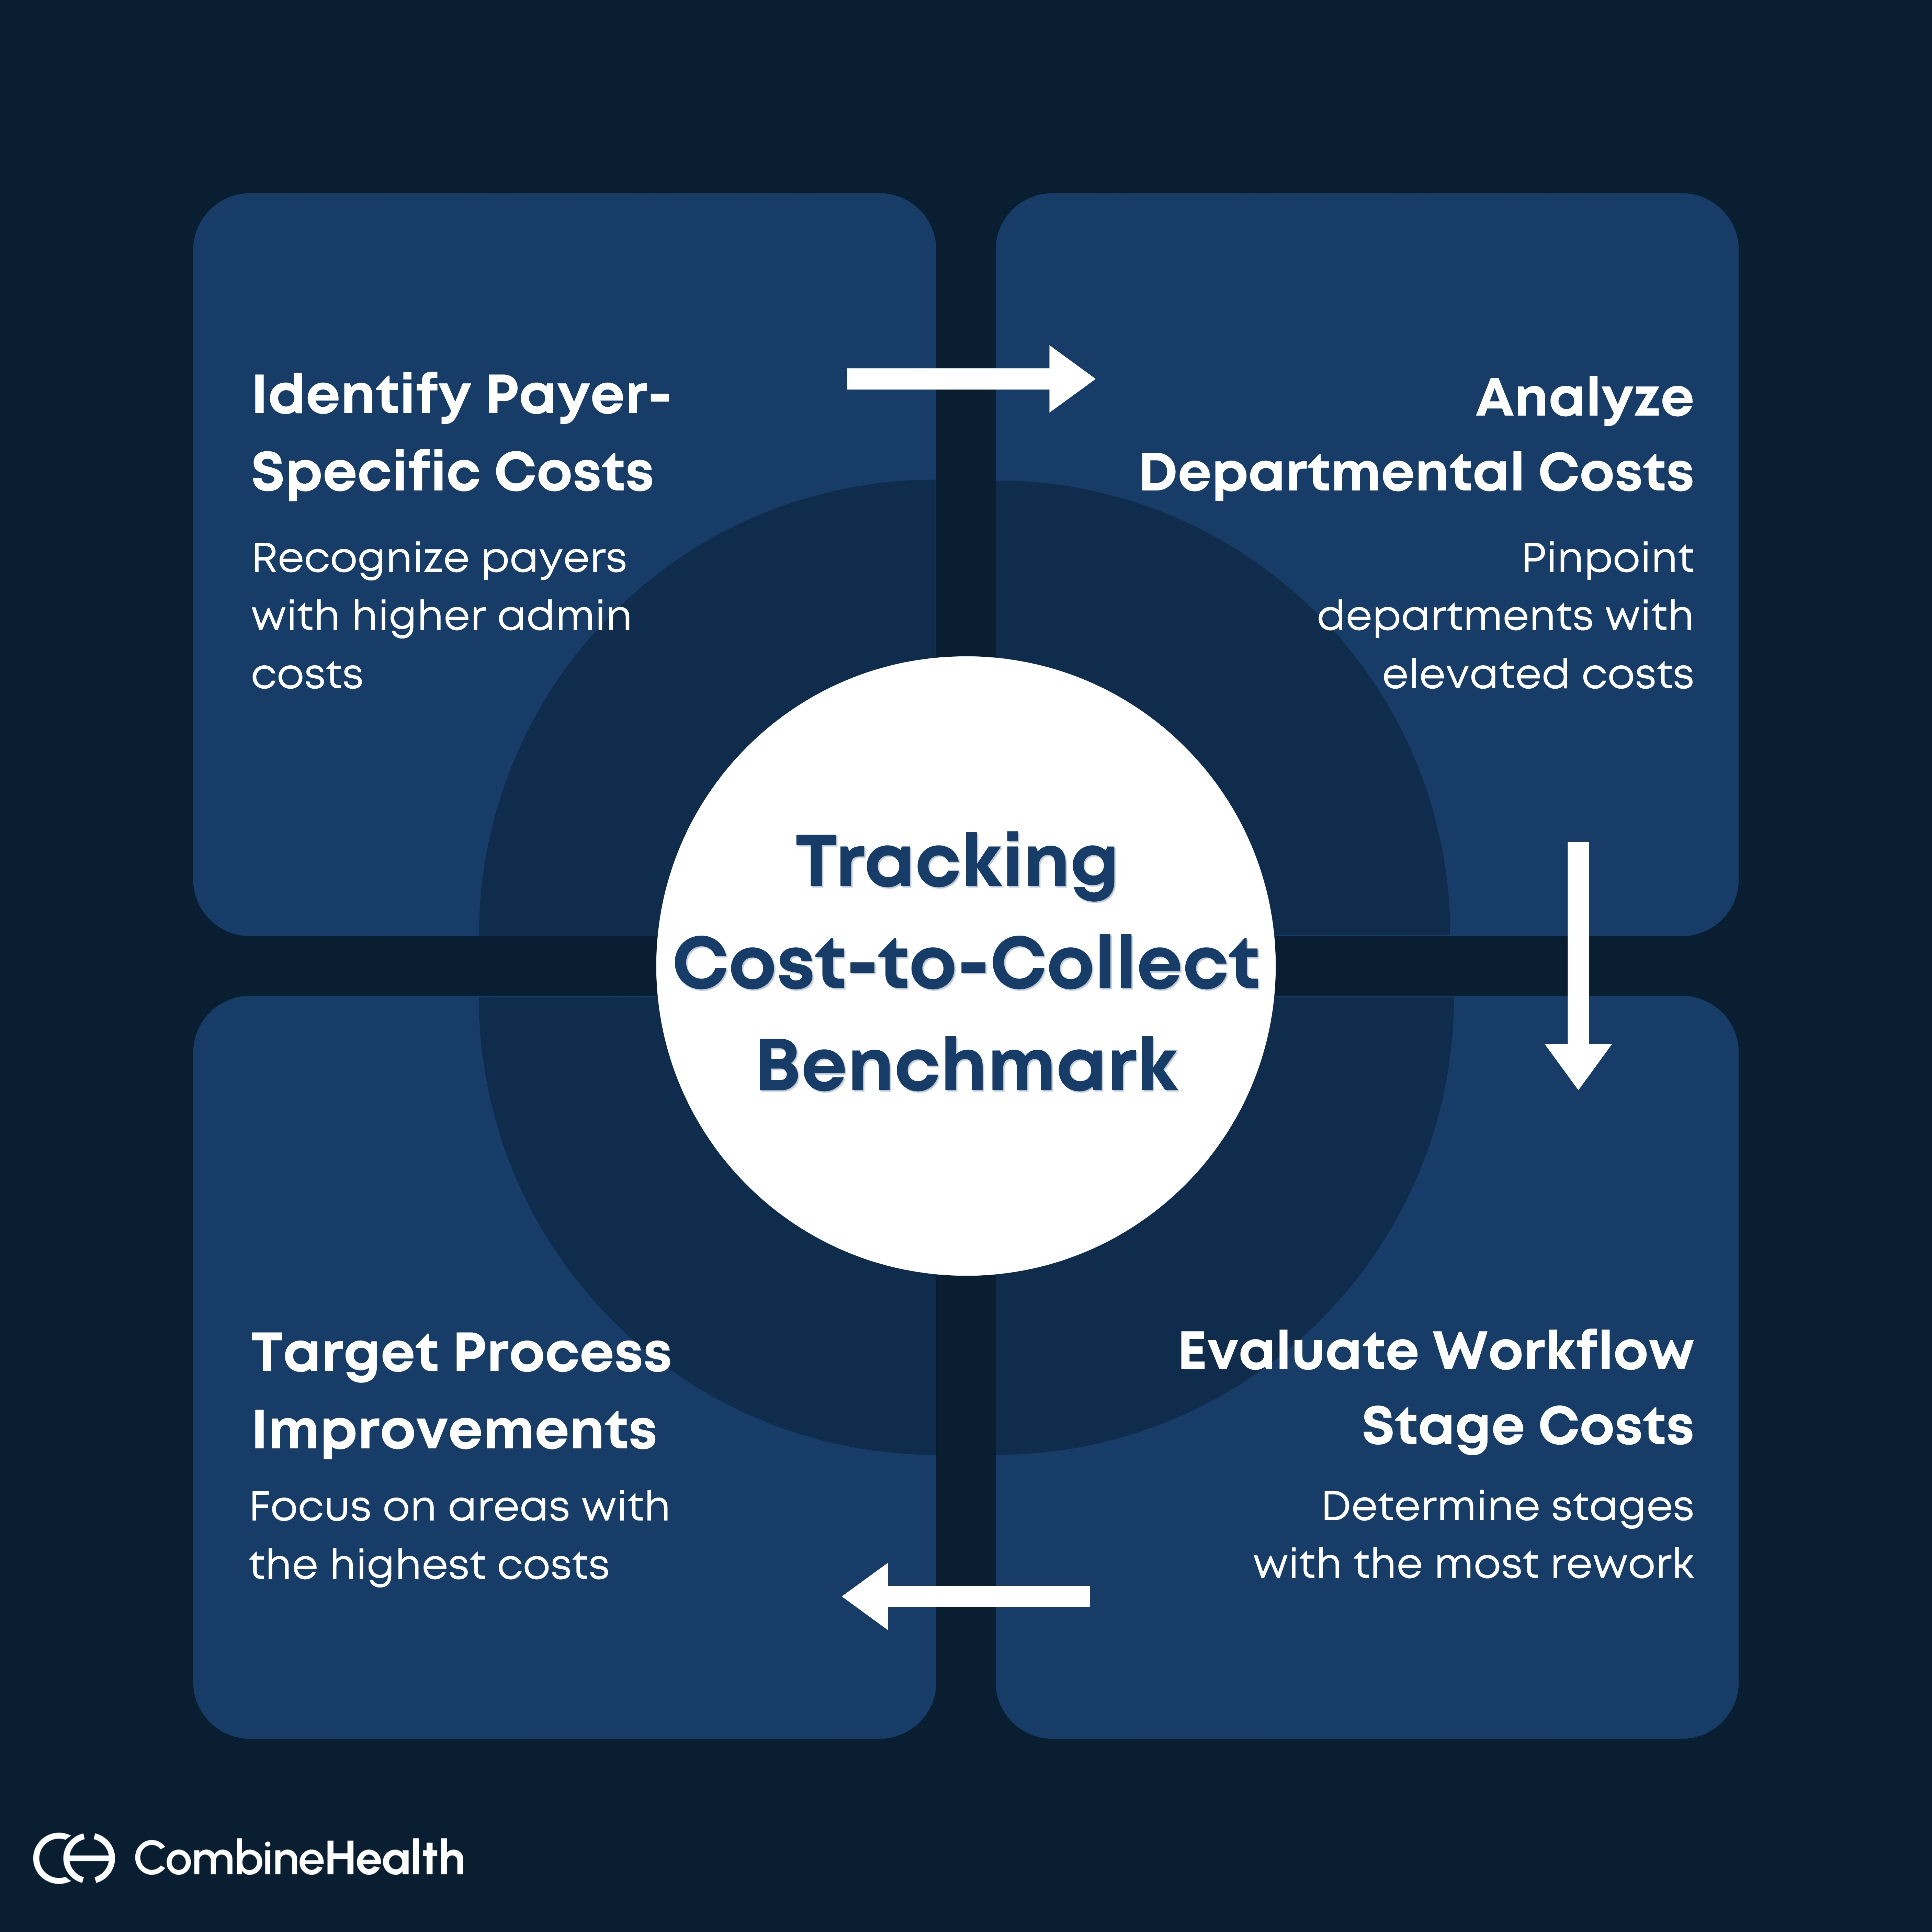
To build the visibility needed to actually reduce cost-to-collect, you need to break it down across three dimensions of the revenue cycle:
- By payer: Some payers generate higher admin costs through denial rates, prior authorization requirements, and portal complexity. Identifying them helps target process improvements.
- By department or service line: Elevated cost-to-collect in one specialty alone often points to coding complexity, documentation gaps, or payer-specific rules that need dedicated attention.
- By workflow stage: Costs behave differently across coding, billing, AR follow-up, and appeals. Knowing which stage is generating the most rework tells you where to intervene first.
How Often Should You Track Cost-to-Collect?
Calculating cost-to-collect once tells you where you stand. But tracking it consistently tells you whether you are moving in the right direction
Most finance teams track it monthly or quarterly using data from the income statement and balance sheet, then trend it over time.
Here’s our recommended cost-to-collect tracking cadence:
How to Reduce Cost-to-Collect in the Revenue Cycle with AI and Automation
As we mentioned earlier, the best-practice benchmark for cost-to-collect has dropped from 3% to 2% over the past five to seven years, and automation is the primary reason why, as per HFMA.
McKinsey’s analysis further supports this—AI enablement in the revenue cycle could cut the cost-to-collect percentage by 30 to 60% by eliminating manual touchpoints, reducing denials, and refocusing staff on higher-value work.
How CombineHealth AI Agents Help Match Your Cost-to-Collect to Industry Standard
For RCM teams looking to move toward that benchmark, CombineHealth's AI workforce provides an end-to-end answer.
Each agent in CombineHealth's RCM suite gives visibility across the multiple dimensions that drive cost-to-collect up and automates the workflows that bring it down:
Jessica (AI Medical Scribe Solution): Incomplete documentation creates downstream coding errors, denials, and rework—all of which inflate cost-to-collect. Jessica captures encounters in real time, generates structured clinical notes, and flags missing details before coding.
Amy (AI Medical Coding Solution): Every coding error is a potential denial, and every denial adds rework cost to your cost-to-collect. Amy assigns CPT, ICD-10, E/M codes, and modifiers at 99.2%+ accuracy, which leads to fewer errors, denials, and lower cost-to-collect.
Penny (AI Policy Review Solution): Claims denied for payer policy mismatches are among the most avoidable (and expensive) drivers of cost-to-collect. Penny validates claims against current Medicare, Medicaid, and commercial payer guidelines before submission to catch compliance issues.
Mark (AI Medical Billing Solution): Manual billing is slow and expensive per claim, and those costs compound into your overall cost-to-collect. Mark automates end-to-end billing across 50+ payer portals, applying payer-specific rules to achieve a 2-3% denial rate—a significant improvement over the industry standard.
Adam (AI Denial Management Solution) AR follow-up is one of the factors that inflate your admin cost over time. Adam automates denial root cause analysis, makes AI-driven calls to payers, and prioritizes high-yield claims—cutting the staff hours required per denial and lowering your cost per dollar collected.
Rachel (AI Appeals Management Solutions): Unresolved denials that never get appealed are revenue left uncollected at a cost already absorbed into your CTC. Rachel drafts evidence-based appeal letters, monitors deadlines, and predicts appeal success probability—recovering more revenue at a much lower admin cost.
Taylor (AI Revenue Cycle Analytics Solution): Reducing cost-to-collect requires knowing exactly where costs are accumulating across your revenue cycle. Taylor monitors claims submission, AR aging, denial trends, and payer-specific performance, surfacing the bottlenecks that inflate cost-to-collect before they compound into larger losses.
.webp)
Bring Your Cost-to-Collect Revenue Cycle Benchmark to Industry Standard (and Below)
A cost-to-collect benchmark is a great signal that your revenue cycle is absorbing costs it should not have to carry—costs from preventable denials, manual rework, slow AR resolution, and inefficient claim preparation.
The path to an industry standard cost-to-collect benchmark runs through the same workflows every time: cleaner claims at submission, fewer denials reaching the AR queue, faster resolution when denials do occur, and visibility that surfaces bottlenecks before they affect your bottomline.
Book a demo to see how CombineHealth's AI agents help you achieve each of these, reduce cost-to-collect, and protect revenue at every step of the cycle!
FAQs
1. What is a good cost-to-collect benchmark in healthcare?
According to HFMA, the best-practice standard for hospitals is at or below 2% of net collections. Organizations above 4% should treat it as an urgent signal to review billing, denial, and coding workflows.
2. What is included in the cost-to-collect calculation?
CTC includes all direct and indirect costs associated with the revenue cycle—staff salaries, technology costs, clearinghouse fees, outsourced billing expenses, denial management labor, and overhead.
3. How often should you calculate cost-to-collect?
Since cost-to-collect is one of the crucial hospital revenue cycle benchmarks, it should be calculated monthly or quarterly, trending it over time to get an accurate picture of operational efficiency.
4. What causes a high cost-to-collect benchmark?
The most common drivers are high denial rates requiring rework, manual billing and coding workflows, inefficient AR follow-up, excessive prior authorization burdens, and technology that does not bring the promised ROI.
5. How to reduce cost-to-collect in RCM?
Reducing CTC requires eliminating the manual touchpoints that generate the most rework, such as documentation, coding, and pre-submission compliance checks. AI-powered RCM agents like CombineHealth's are built specifically to automate each of these stages.