8 Revenue Cycle Management Metrics Every Healthcare CFO Should Track
Understand the key revenue cycle management metrics healthcare RCM leaders should track to reduce claim denials.
February 5, 2026


Key Takeaways:
• Revenue cycle management metrics are only valuable when they drive action, not just reporting.
• Many claim denials stem from front-end issues like eligibility, registration, and authorization errors.
• CFOs should focus on prevention-focused RCM KPIs, not just outcome metrics like collections or A/R days.
• Metrics such as claim completeness rate and first-pass acceptance rate surface revenue risk earlier.
• Breaking down denials by cause helps teams fix root issues rather than repeatedly appealing claims.
• Cost to collect is critical for understanding efficiency and evaluating AI vendor ROI.
• Effective AI tools connect RCM metrics to action, helping teams prevent denials and reduce rework.
• Tracking trends, segmenting data, and assigning ownership are key to improving revenue predictability.
Imagine a hospital without a financial command center.
Coders are submitting claims based on incomplete documentation. Billers are chasing payers across five different portals. Denials pile up in spreadsheets. And the CFO keeps asking the same question every month: Why does our revenue look fine on paper but broken in reality?
That’s what most revenue cycle operations look like without the right metrics in place.
A report by KFF says about 19% of in-network claims and 37% of out-of-network claims were denied in 2023, translating to billions in lost reimbursements and preventable operational costs for hospitals and physician groups.
To regain control, healthcare finance leaders need more than dashboards. They need revenue cycle management metrics that explain why performance is slipping and where intervention will actually move the needle.
This blog breaks down the most important RCM metrics every healthcare CFO should track and how to use them to evaluate whether your current RCM tools or AI vendors are truly helping, or just adding another layer of noise.
What Are Revenue Cycle Management Metrics?
Revenue cycle management metrics show how effectively a healthcare organization converts patient care into collected revenue. They track performance across the full revenue cycle—from registration and insurance verification to billing, collections, and denial management.
These metrics measure whether claims are submitted correctly, payments are received on time, and revenue leakage is being prevented. When tracked consistently, they help teams understand where revenue slows down, where it breaks, and why.
However, different leaders rely on RCM metrics for different signals.
For example, CFOs monitor a small set of high-impact indicators to assess cash flow, financial risk, and overall efficiency. RCM Directors and Billing Managers focus on operational metrics that reveal day-to-day issues, such as documentation gaps, claim errors, or payer-specific bottlenecks.
Tracking the right RCM metrics allows teams to identify problems early, prioritize corrective action, and protect revenue before small issues turn into systemic losses.
How to Know If Your RCM Metrics Are Actually Useful
Tracking the right revenue cycle management metrics helps CFOs and RCM leaders move from reactive fixes to proactive control. These metrics should reveal:
- where revenue is leaking
- where processes are breaking down
- where teams need to focus first
Most RCM analytics often show numbers without explaining why performance is changing or what teams should do next. As a result, leaders review reports regularly, yet issues like denials, delayed payments, and rework persist.
One reason most dashboards fail is that they focus only on outcomes. Metrics such as total collections or A/R days matter, but they don’t show where breakdowns occur earlier in the revenue cycle. Without that visibility, teams react only after revenue is already at risk.
Another warning sign is when AI or analytics tools provide data without insight. If metrics can’t be broken down by payer, provider, or workflow, they won’t drive improvement.
Useful RCM KPIs help teams spot risk early, understand root causes, and prevent revenue loss, not just report it. That means tracking metrics that surface problems before claims are submitted or denied, such as claim completeness, first-pass acceptance, authorization accuracy, and denial trends by cause.
8 Key RCM Metrics To Reduce Claim Denials
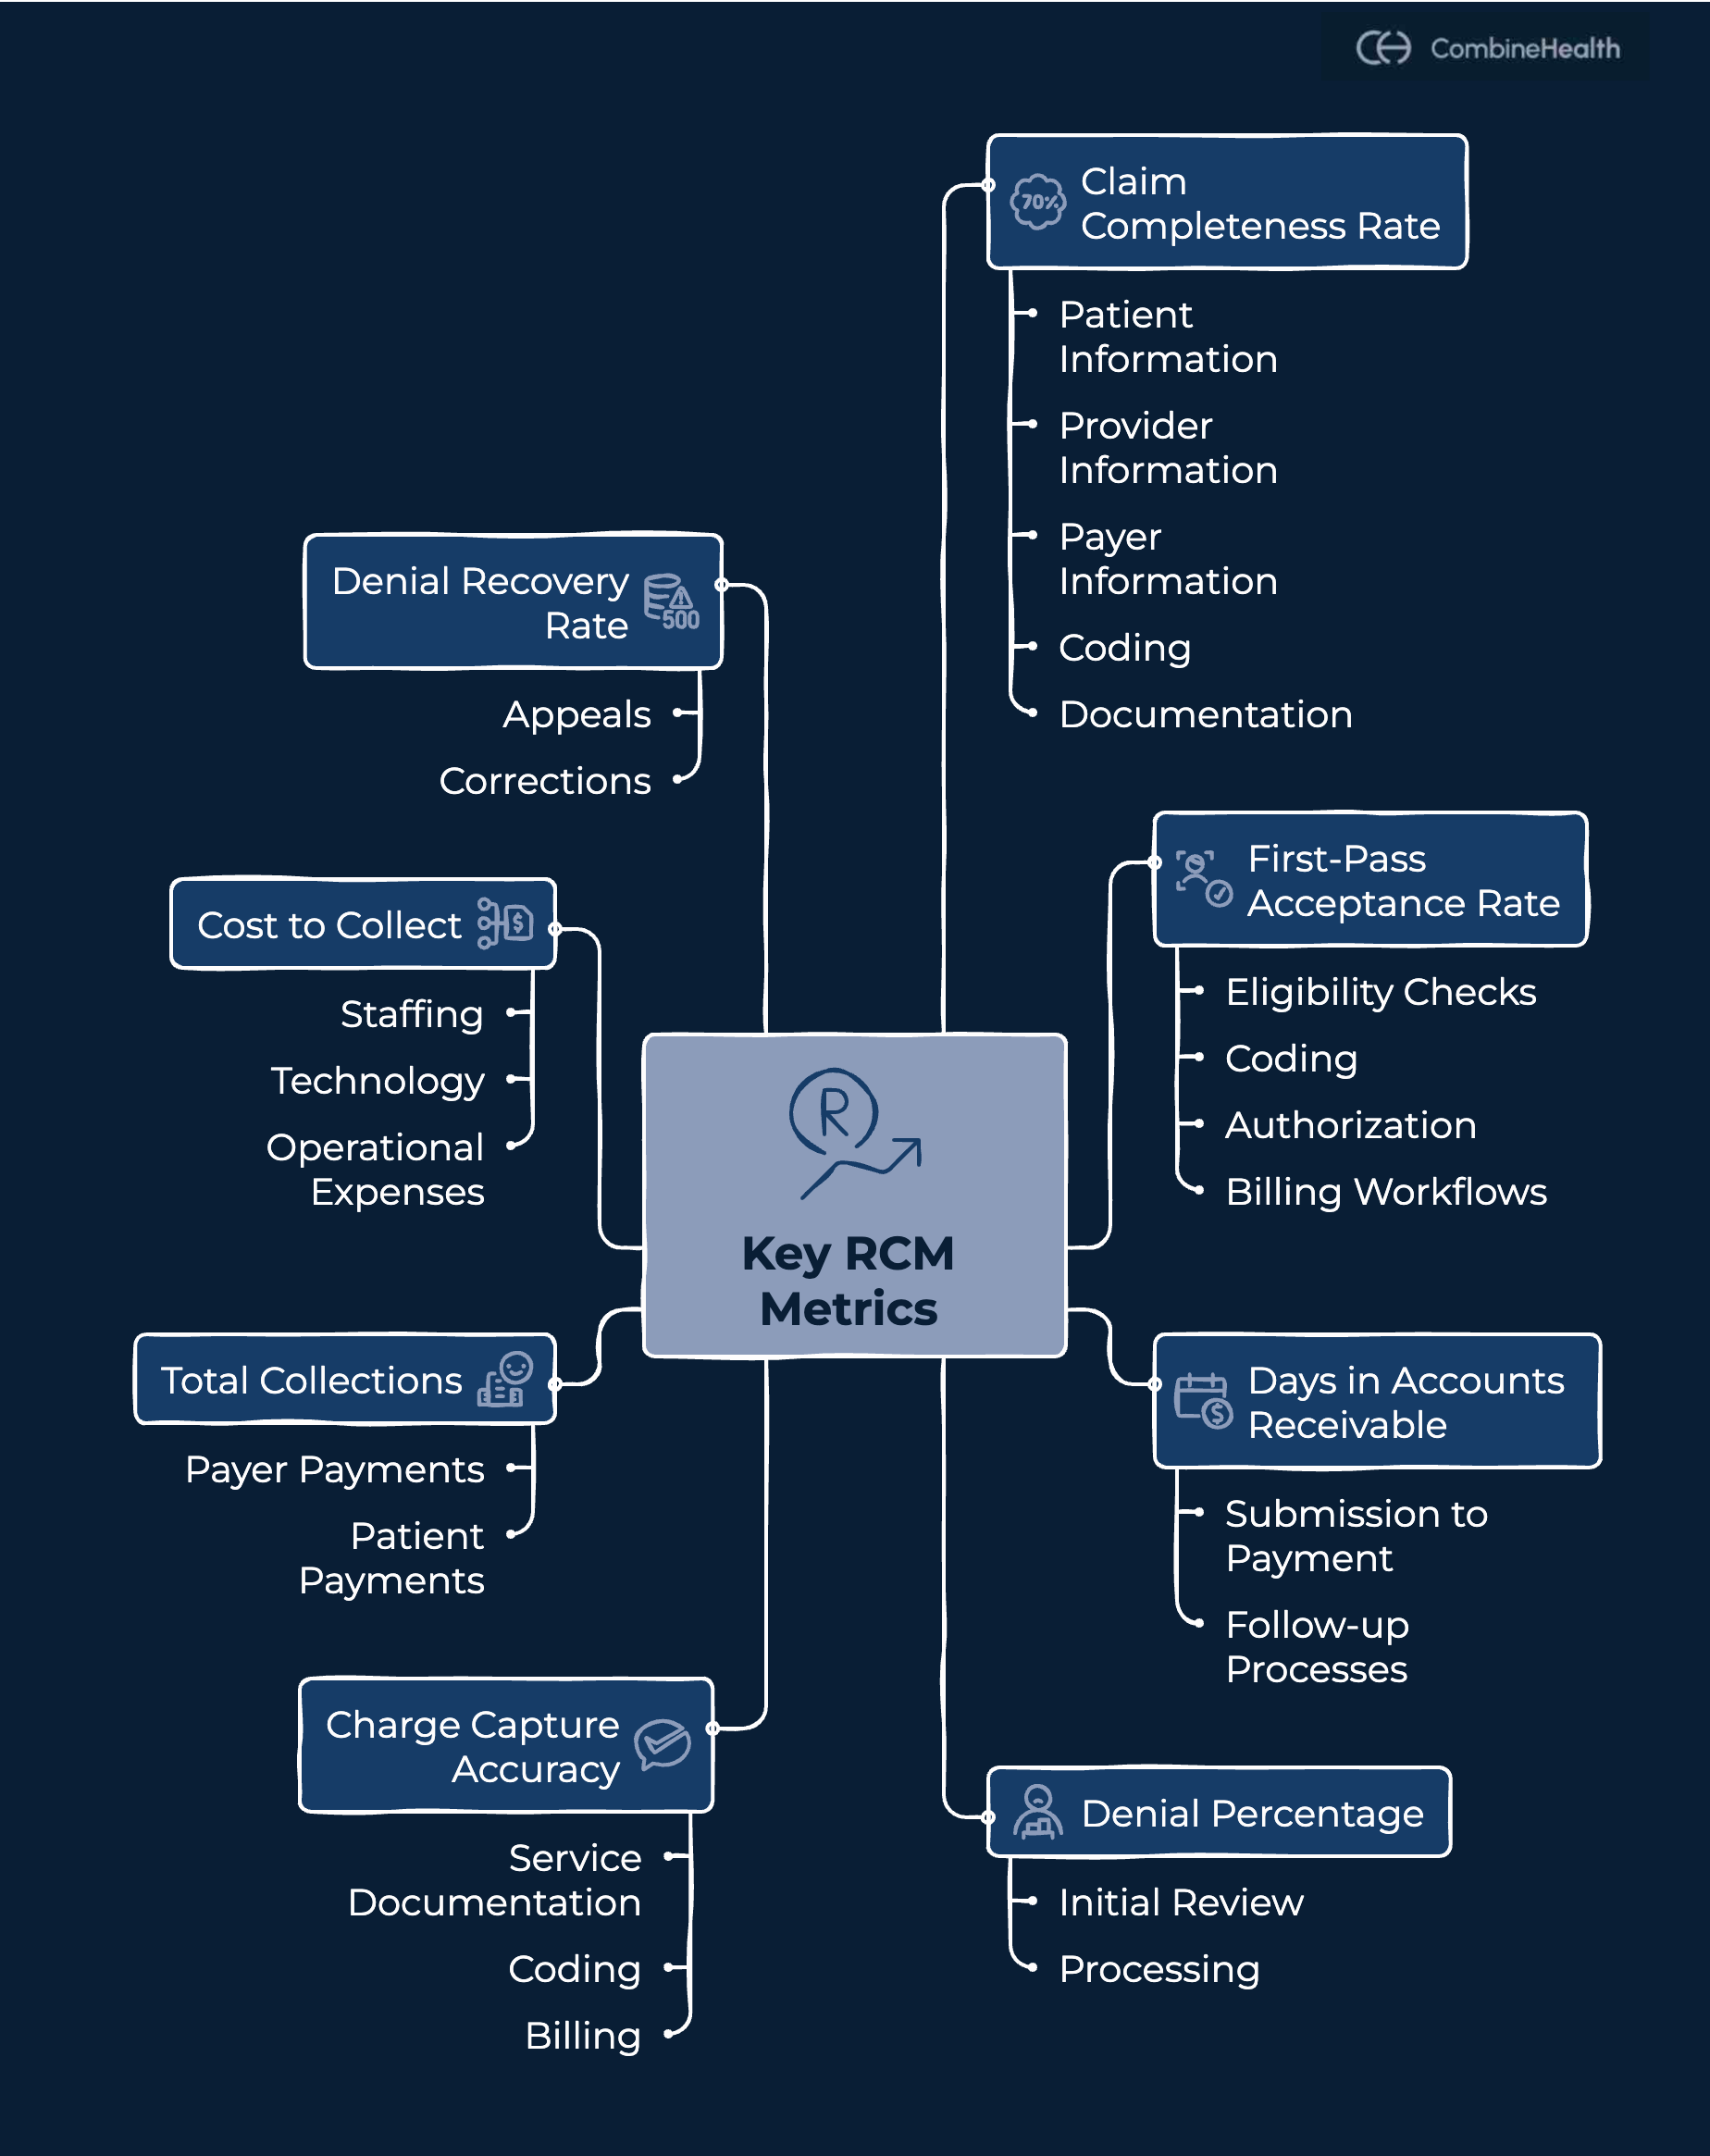
Below are eight essential RCM metrics. For each one, we explain what it measures, why it matters, when to track it, how to calculate it, and how to use it to improve revenue cycle performance.
1. Claim Completeness Rate
Claim completeness rate indicates the percentage of claims submitted with all required patient, provider, payer, coding, and documentation elements present at the time of submission. This metric helps RCM teams avoid rejections and downstream denials caused by missing or incorrect information. It also reduces manual follow-up work for billing and denial teams by ensuring claims are clean before they ever reach a payer.
When to track: Daily or weekly
Formula: Complete claims ÷ Total claims submitted × 100
How to use this metric to improve RCM
A low claim completeness rate points to gaps at intake, documentation, or coding. Teams should review incomplete claims weekly, identify common missing elements, and update intake checklists, documentation standards, and pre-submission checks accordingly.
In our previous discussion with Symone (a denials expert at SSM Health) consistently stressed the importance of upstream accuracy. When claims are incomplete at submission, teams are forced to perform reactive cleanup later, spending time fixing denials that could have been prevented altogether.
2. First-Pass Acceptance Rate (FPAR)
First-pass acceptance rate measures the percentage of claims that payers accept on the initial submission without requiring corrections or resubmission. This metric reflects how well eligibility checks, coding, authorization, and billing workflows are functioning together at the point of submission.
A strong FPAR indicates that claims are being built the first time correctly, while a decline often signals breakdowns that lead to delays, rework, and avoidable denials.
When to track: Weekly and monthly
Formula: Claims accepted on first submission ÷ Total claims submitted × 100
How to use this metric to improve RCM
When first-pass acceptance rates decline, teams should identify where claims are failing, such as eligibility checks, authorizations, coding, or payer rules, and address those gaps upstream. Breaking down rejections by payer and workflow stage helps identify fixes to prevent repeat errors. FPAR also helps teams assess whether automation is reducing errors or simply shifting work downstream.
3. Days in Accounts Receivable (A/R Days)
Days in accounts receivable measures the average number of days it takes to collect payment after services are rendered. This metric reflects how efficiently claims move from submission to payment and how effective follow-up processes are once claims are outstanding.
Rising A/R days indicate slower cash flow, delayed payer responses, or gaps in follow-up workflows.
When to track: Monthly, with trend analysis
Formula: Total A/R ÷ Average daily charges
How to use this metric to improve RCM
When A/R days rise, teams should segment balances by payer, service line, or denial type to pinpoint delays. Prioritizing follow-up on high-risk or high-value claims and escalating stalled accounts sooner helps improve cash flow without adding manual workload.
Recommended Reading: AR Scenarios in Healthcare RCM
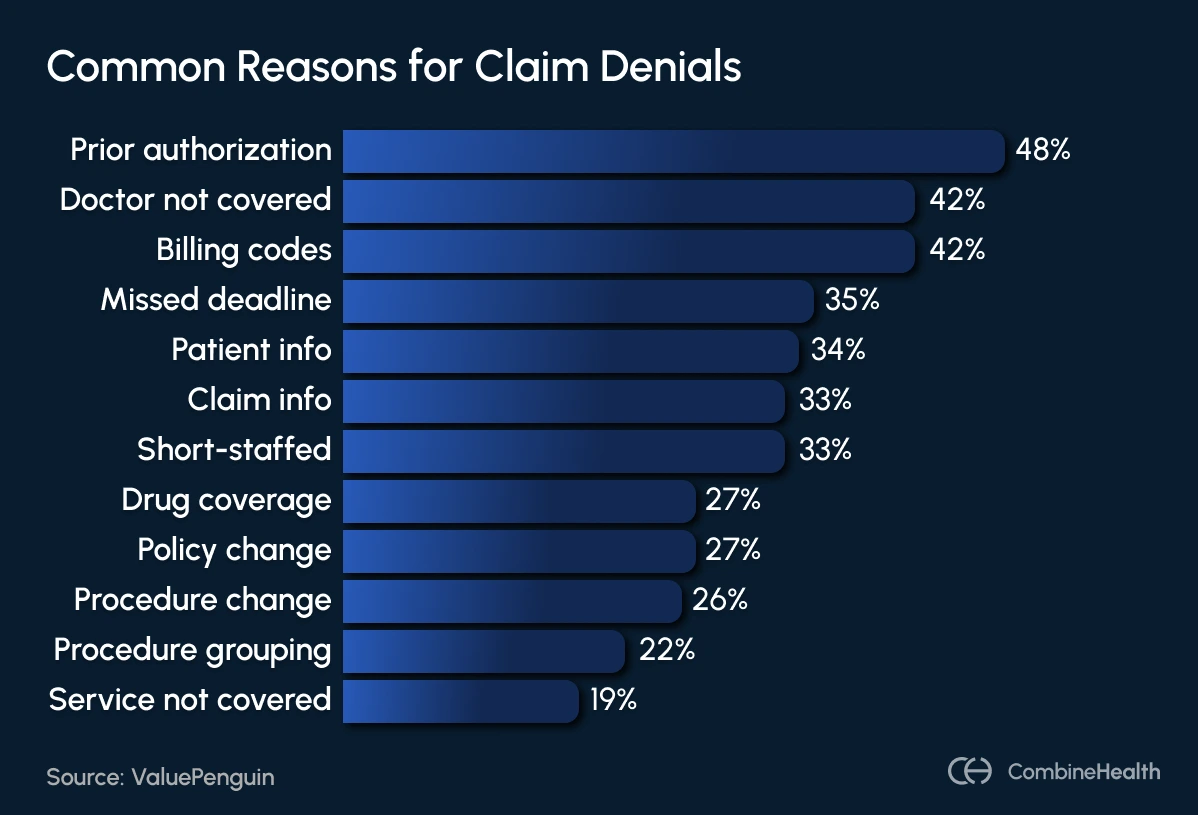
4. Denial Percentage
Denial percentage measures the portion of submitted claims that payers deny, either at initial review or after processing. This metric is one of the clearest indicators of revenue leakage and breakdowns across the revenue cycle.
A rising denial rate increases rework, delays payments, and diverts staff time toward claim appeals rather than prevention.
When to track: Monthly, with payer-level analysis
Formula: Denied claims ÷ Total claims submitted × 100
How to use this metric to improve RCM
When denial rates rise, teams should categorize denials by root cause, such as insurance eligibility issues, missing or expired authorizations, coding errors, or documentation gaps. Review trends by payer and provider to identify repeat patterns rather than isolated errors.
As Symone has highlighted in denial management discussions, tracking the denial rate alone isn’t enough. Understanding why denials occur is what enables teams to prevent them upstream.
5. Charge Capture Accuracy
Charge capture accuracy measures how correctly services provided to patients are documented, coded, and billed. This metric ensures that all billable services are captured and submitted without omissions or errors.
Missed or inaccurate charges reduce revenue quietly and often go undetected because they don’t always trigger claim denials.
When to track: Monthly or through regular audits
Formula: Correct charges ÷ Total charges identified
How to use this metric to improve RCM
To improve charge capture accuracy, teams should audit high-risk services and compare clinical notes against billed charges to identify gaps. Aligning documentation standards with billing workflows and reinforcing charge capture at the point of care helps protect revenue that would otherwise go unnoticed.
6. Total Collections
Total collections measure the actual payments received from payers and patients, reflecting how much revenue the organization ultimately realizes, not just what is billed. This metric provides a reality check on revenue performance by showing whether billed charges are converting into cash.
When to track: Monthly
Formula: Total payments received ÷ Total charges
How to use this metric to improve RCM
Review total collections, denial rates, and days in accounts receivable to identify gaps between expected and actual revenue. When collections fall short, investigate upstream contributors such as eligibility errors, missing authorizations, delayed follow-ups, or unresolved denials.
Tracking these metrics together helps teams pinpoint where revenue is being lost and prioritize fixes that improve cash flow without increasing manual effort.
7. Cost to Collect
Cost to collect measures how much it costs an organization to collect each dollar of revenue across the revenue cycle. This includes staffing, technology, and operational expenses tied to RCM activities.
Strong collections alone don’t guarantee efficiency. This metric helps CFOs understand whether revenue growth is driven by better performance or higher operational effort.
When to track: Quarterly
Formula: Total RCM operating costs ÷ Total collections
How to use this metric to improve RCM
When the cost to collect rises, teams should examine sources of operational waste, like manual rework, repeated payer follow-ups, high denial volumes, or staffing strain. Breaking costs down by function, like coding, billing, denial management, and follow-up, helps identify where effort is expanding without proportional returns. Cost to collect is also critical for evaluating AI vendor ROI.
8. Denial Recovery Rate
Denial recovery rate measures the percentage of denied claims that are successfully recovered through appeals or corrections. While denial rates show how often claims are rejected, the recovery rate reveals how much revenue is actually saved.
A low recovery rate means denied claims are turning into permanent revenue loss.
When to track: Monthly
Formula: Recovered denials ÷ Total denied claims × 100
How to use this metric to improve RCM
When denial recovery rates are low, teams should review appeal workflows, documentation quality, and prioritization criteria. Segment denials by type, such as eligibility, authorization, coding, or documentation, and focus appeals on high-value or high-success categories.
As Marc McCauley, an RCM leader with decades of experience, has noted, effective denial management depends on structured tracking and root cause analysis, not just reactive appeals. Separating denial types, including prior authorization denials, helps teams apply the right fixes and prevent repeat issues. Addressing authorization gaps early also reduces the number of denials that ever need to enter the recovery process.
Using RCM Metrics to Evaluate Your AI Vendor
Many AI tools promise better revenue cycle performance, but not all deliver measurable results. Revenue cycle management metrics help CFOs evaluate whether an AI vendor is creating real value or just improving visibility.
Users should be able to break down metrics to gain insights such as which payers denied the most, which provider has the most denials, and the common denial causes.
CFOs should be able to answer critical questions instantly. For example:
- Are first-pass acceptance rates improving?
- Are denials decreasing due to better upstream checks?
- Are A/R days and operational costs trending down?
Visibility alone isn’t enough. Effective AI must connect revenue cycle metrics to action. Without that link, insights remain passive, and risk remains unchanged.
How CombineHealth Helps Teams Track and Act on RCM Metrics
Tracking revenue cycle management metrics adds value only when teams can act on them. That’s where Taylor, CombineHealth’s AI analytics solution, comes in.
Taylor is designed to help RCM teams move beyond static reporting and turn RCM metrics into decisions. Instead of just showing what happened, Taylor highlights where revenue risk is coming from and how it’s changing over time.
.png)
A key part of this is Taylor’s Denials Dashboard, which gives teams a clear, consolidated view of denial performance across the organization. It surfaces:
- Denial percentage to track overall denial risk
- Denials by the payer to identify problematic payers
- Denials by the provider to uncover workflow or documentation gaps
- Monthly denial trends to spot patterns early
With this level of visibility, CFOs and RCM leaders can move faster, prioritize fixes, validate the impact of AI vendors, and focus on prevention rather than cleanup.
Best Practices for Tracking Revenue Cycle KPIs Effectively
To get real value from revenue cycle KPIs, healthcare teams need to track them with intent, not just review reports.
- Track trends, not snapshots. A single data point rarely tells the full story. Monitoring how metrics like denial percentage, first-pass acceptance rate, or A/R days change over time helps teams spot risk early.
- Segment metrics by payer, provider, and service line. Aggregate numbers often hide problems, while segmentation reveals where breakdowns are occurring and why.
- Assign clear ownership. Each KPI should have a designated owner responsible for monitoring performance and driving follow-up actions.
- Use metrics to prevent issues, not just report them. High-performing RCM teams rely on KPIs to identify eligibility gaps, authorization risks, and documentation issues before they lead to denials.
Turn RCM Data Into Actionable Revenue Control
Revenue cycle management metrics matter only when they lead to better decisions and measurable improvements. For healthcare CFOs and RCM leaders, the goal isn’t to track more numbers; it’s to track the right ones and act on them early.
By focusing on prevention-focused metrics like claim completeness, first-pass acceptance, and denial trends by cause, teams can reduce rework, protect revenue, and improve predictability. When paired with actionable analytics and clear ownership, these metrics also become a powerful way to evaluate whether AI tools are truly improving performance or just adding visibility.
Explore how CombineHealth brings clarity and control to revenue cycle performance. Book a demo today!
FAQs
What are the most important RCM KPIs for CFOs?
The most important RCM KPIs for CFOs include denial percentage, first-pass acceptance rate, days in accounts receivable, cost to collect, and total collections.
How often should RCM metrics be reviewed?
Core RCM metrics should be reviewed weekly or monthly, depending on the metric.
What’s the difference between revenue cycle metrics and KPIs?
Revenue cycle metrics measure performance across billing and collections. RCM KPIs are the most critical metrics leadership uses to track financial health and guide decisions.
How do I know if my AI RCM vendor is effective?
An effective AI RCM vendor improves outcomes, not just visibility. Denial rates, first-pass acceptance, A/R days, and cost to collect should improve over time.
Which metrics help reduce denials the most?
Claim completeness rate, first-pass acceptance rate, denial percentage by cause, and authorization accuracy help prevent denials by identifying issues before claims are submitted.