Revenue Cycle Analytics: Why It’s Crucial for Reducing Revenue Leakage in Healthcare
Learn how revenue cycle analytics helps healthcare teams reduce denials, track KPIs, identify revenue leakage, and improve financial performance.
February 20, 2026


Key Takeaways
• Revenue cycle analytics helps healthcare organizations identify patterns across coding, billing, and payer responses, making it easier to detect revenue leakage early and take corrective action.
• Traditional reporting shows what happened, but revenue cycle analytics explains why issues occur and helps teams prioritize the next steps to improve performance.
• Revenue leakage often results from recurring problems such as preventable denials, underpayments, workflow delays, or documentation gaps that become visible only through structured analytics.
• Different types of analytics (descriptive, diagnostic, predictive, and prescriptive) help teams understand past performance, uncover root causes, anticipate risks, and guide operational decisions.
• Tracking the right RCM metrics gives organizations a clearer view of financial performance and workflow efficiency.
• A structured analytics process, from data collection and normalization to pattern identification and continuous monitoring, enables sustainable revenue cycle improvement.
• AI-powered revenue cycle analytics tools like CombineHealth’s Taylor help unify data, monitor KPIs, analyze denial trends, and prioritize high-impact opportunities to reduce revenue loss.
Healthcare revenue loss rarely stems from a single major breakdown for healthcare providers. It arises mostly from small inefficiencies that accumulate across the revenue cycle—missed denials, underpayments that go unnoticed, delayed follow-ups, or coding inconsistencies that recur over time.
A report shows that claim denials continue to rise, with initial denial rates reaching nearly 11.8%, creating significant operational and financial pressure on billing teams. Providers also fail to collect roughly 2–5 % of net patient revenue due to inefficient revenue cycle management and unresolved claims, highlighting how hidden gaps can directly affect financial performance. Strengthening revenue cycle management processes through structured analytics helps organizations address these gaps more systematically.
This is where revenue cycle analytics becomes crucial. Instead of individual claim review, revenue cycle analytics helps teams identify patterns and connect data across the revenue cycle. With proper analytics set up in place, healthcare organizations can detect revenue leakage earlier, prioritize high-impact issues, and make informed decisions that improve cash flow and operational efficiency.
In this guide, we’ll break down what revenue cycle analytics is, how revenue cycle analytics for medical practices improves financial visibility, why it matters for healthcare organizations, the key metrics teams should track, and how a structured analytics process helps reduce preventable revenue loss.
What Is Revenue Cycle Analytics?
Revenue cycle analytics is the process of analyzing data across the healthcare revenue cycle to understand financial performance, identify operational gaps, and improve reimbursement outcomes.
It helps teams involved in revenue cycle management understand why issues occur and what actions should be taken next by connecting data from multiple RCM stages, including coding, billing, payer responses, denials, and payment trends. This helps uncover patterns that may not be visible when reviewing individual claims.
In practice, healthcare revenue cycle analytics answers questions like:
- Where are claims most often delayed or denied?
- Which payers or procedures generate recurring issues?
- Are underpayments or coding inconsistencies affecting revenue?
- Which operational changes will have the biggest impact on cash flow?
A revenue cycle analytics platform enables organizations to centralize this data, automate performance tracking, and generate actionable insights across the revenue cycle.
Why Revenue Cycle Analytics Matters for Reducing Revenue Leakage
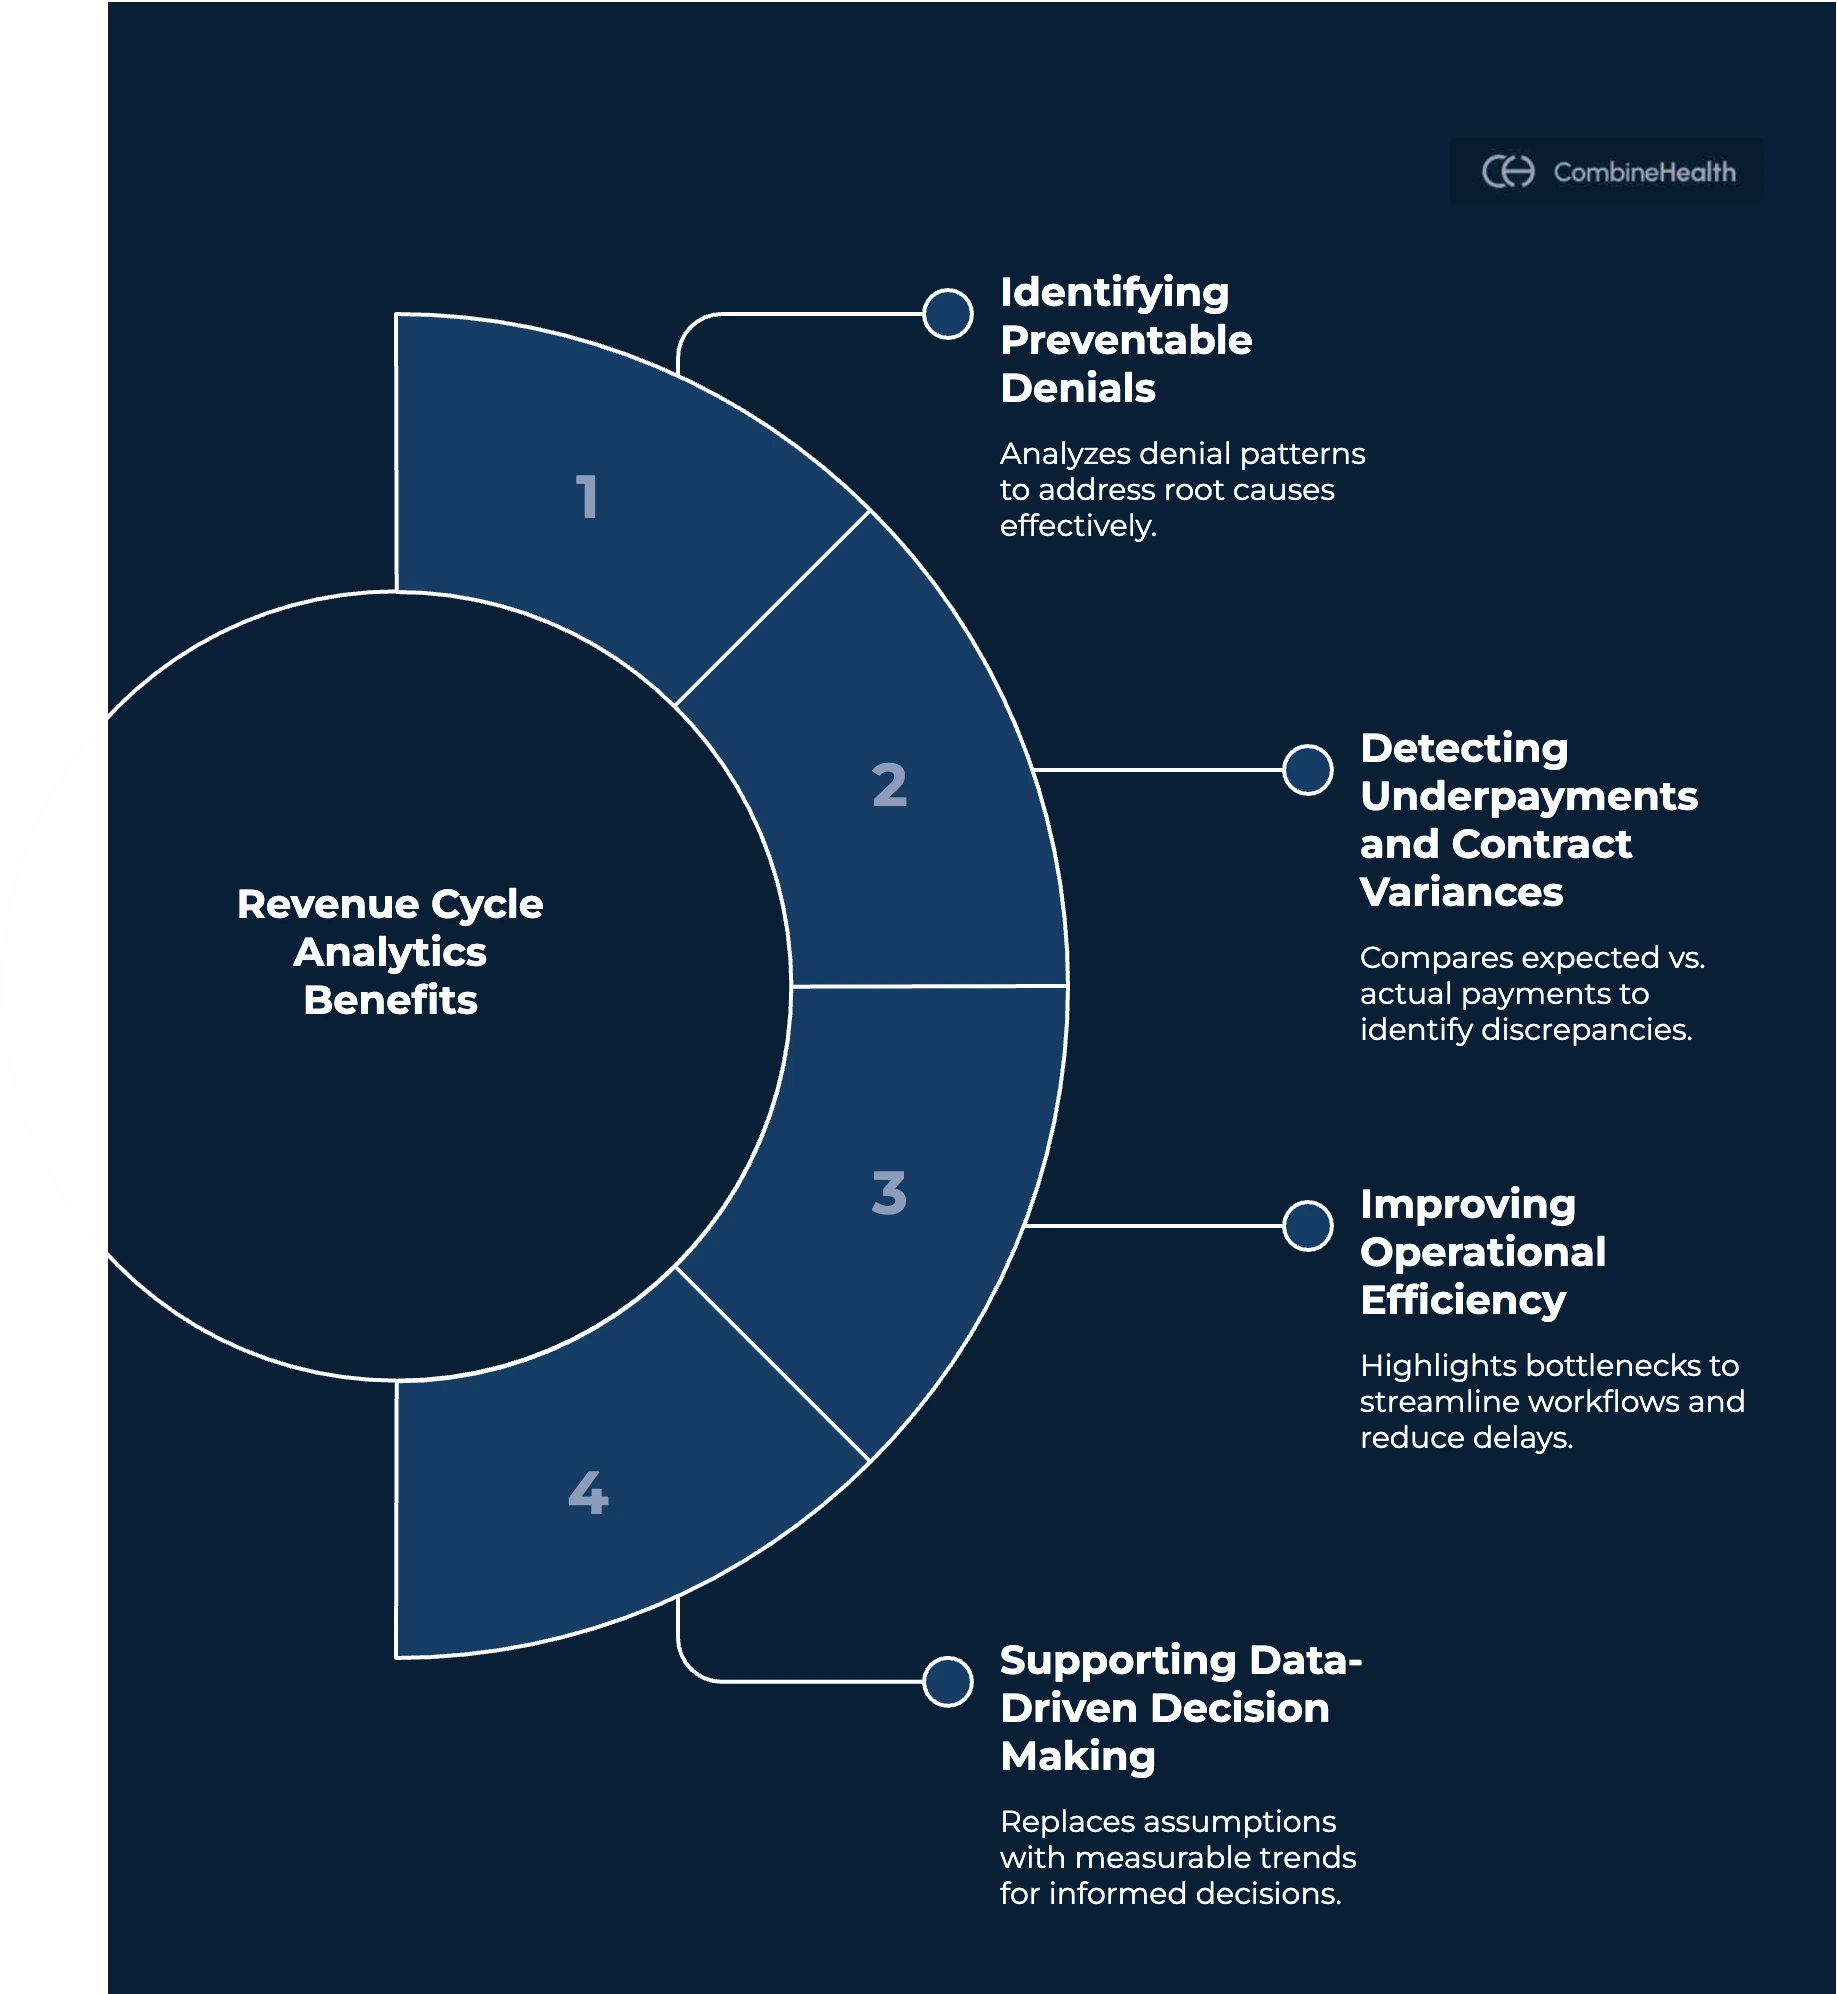
Revenue cycle analytics helps healthcare organizations move from reactive problem-solving to proactive improvement by showing where revenue is being lost and why. Here’s how it helps:
Identifying Preventable Denials
Many claim denials follow predictable patterns tied to documentation gaps, authorization issues, or payer-specific rules. When teams only review denials one by one, it’s difficult to see recurring trends.
Analytics aggregates denial data across claims and payers, helping teams answer questions like:
- Which denial reasons appear most frequently?
- Are certain procedures or providers more affected?
- Which payers have higher denial rates?
By identifying these patterns, organizations can address root causes instead of repeatedly correcting similar errors.
Detecting Underpayments and Contract Variances
Revenue leakage doesn’t always come from outright denials. Underpayments, where payers reimburse less than expected, often go unnoticed when teams lack structured analytics.
Revenue cycle analytics compares expected reimbursement with actual payment data to identify:
- Contractual discrepancies
- Payer inconsistencies
- Missed revenue opportunities
This allows billing teams to prioritize recovery efforts and prevent ongoing losses.
Improving Operational Efficiency
Manual workflows make it difficult to track where delays occur. Revenue cycle analytics highlights bottlenecks like:
- Claims stuck in accounts receivable
- Slow AR follow-ups after denials
- Coding errors that require repeated corrections
With better visibility into workflow performance, teams can adjust processes to reduce delays and improve cash flow.
Supporting Data-Driven Decision Making
Perhaps the biggest advantage of healthcare revenue cycle analytics is that it replaces assumptions with data. Instead of guessing which issues matter most, teams can focus on high-impact problems supported by measurable trends.
Over time, this leads to:
- Fewer preventable denials
- Faster payment cycles
- Improved financial stability
Recommended reading: Understanding Medical Decision Making in Healthcare and Why It Matters
Types of Healthcare Revenue Cycle Analytics
Revenue cycle analytics is not a single process. It includes different types of analysis that help teams understand past performance, diagnose problems, and improve future outcomes. Each type plays a role in reducing revenue leakage and improving operational decisions.
Descriptive Analytics: What Happened?
Descriptive analytics focuses on summarizing historical performance. It helps teams understand what has already occurred across the revenue cycle.
Examples include:
- Monthly denial rates
- Average days in accounts receivable (A/R)
- Claim acceptance rates
- Payment turnaround times
This type of analysis provides visibility into performance trends but does not explain the underlying causes.
For example, a billing team may see that denial rates increased last month, but descriptive analytics alone won’t explain why.
Diagnostic Analytics: Why Did It Happen?
Diagnostic analytics goes deeper by identifying root causes behind performance changes.
Instead of only tracking denial rates, diagnostic analysis examines:
- Specific denial codes
- Payer behavior patterns
- Coding or documentation issues
- Workflow delays
For instance, diagnostic analytics may reveal that a sudden increase in denials is linked to a specific CARC code tied to missing clinical documentation for a particular procedure. By analyzing historical patterns and payer responses, teams can identify underlying issues, like incomplete clinical notes or incorrect coding, and implement targeted corrections.
For coders and denial managers, this type of insight helps identify recurring problems that lead to preventable revenue loss.
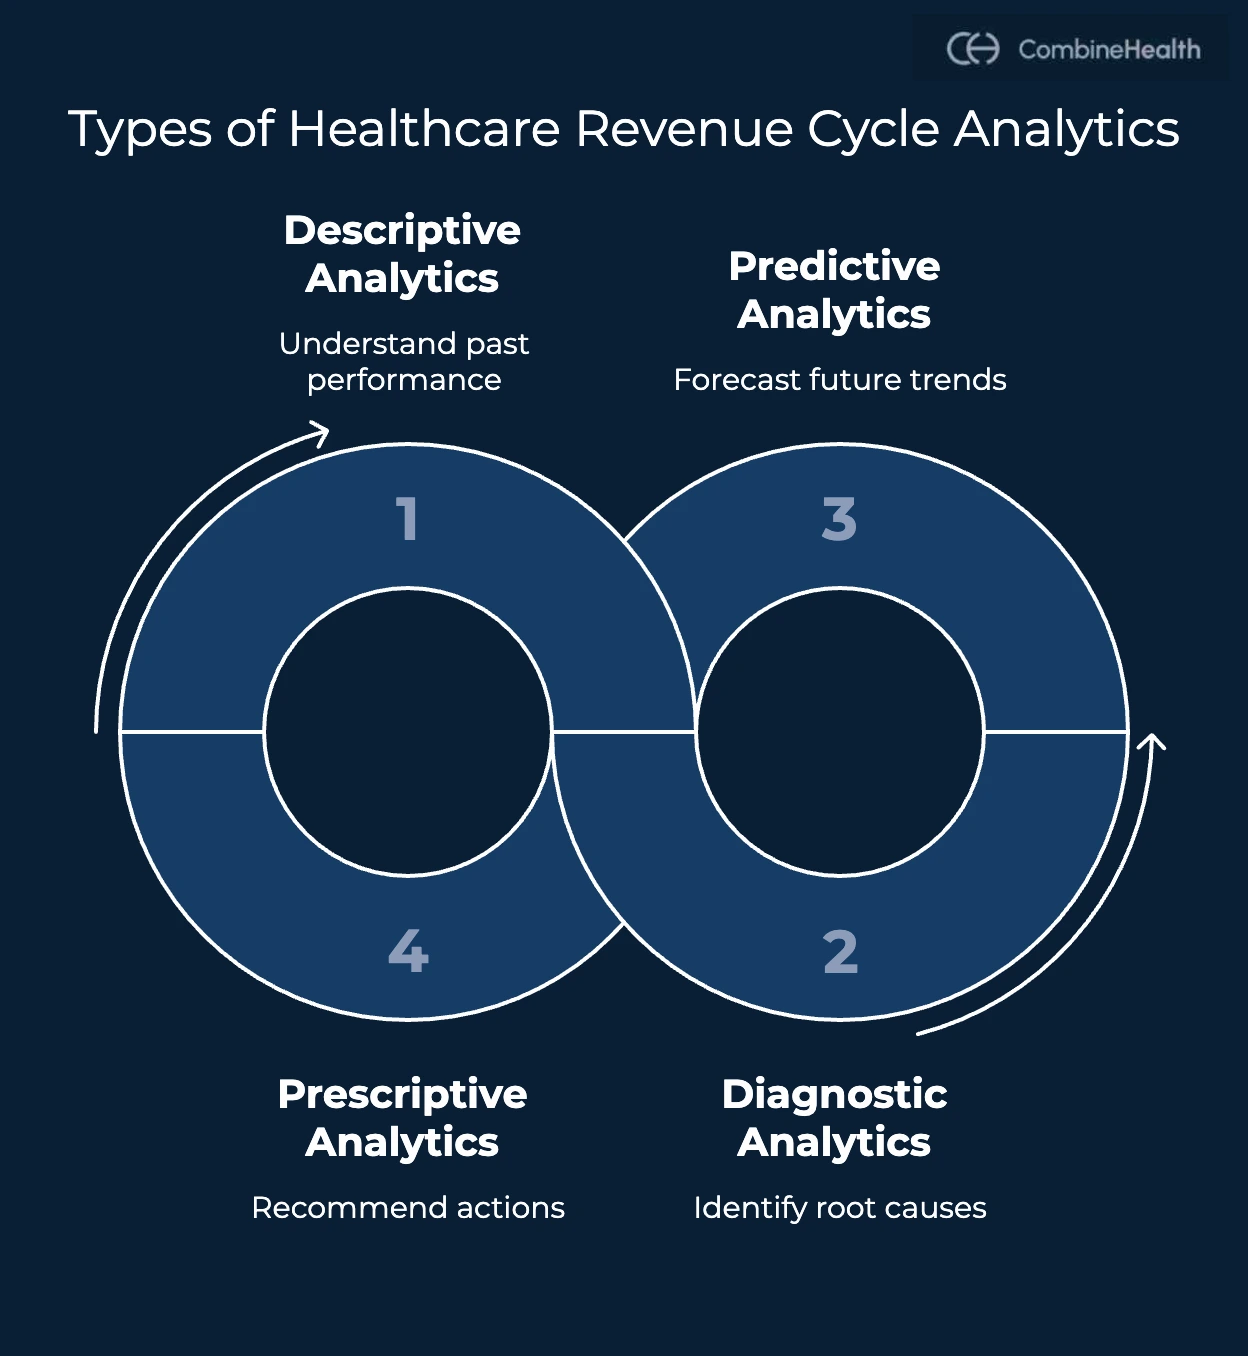
Predictive Analytics: What Might Happen Next?
Predictive analytics uses historical patterns to forecast future outcomes. In revenue cycle management, this may include:
- Predicting which claims are likely to be denied
- Identifying high-risk procedures or payers
- Forecasting cash flow trends
For example, predictive analytics may identify that claims submitted for a specific procedure code to a particular payer are more likely to be denied due to missing prior authorization details. Billing teams can then review documentation before submission, reducing the risk of rejection and avoiding reimbursement delays.
By anticipating potential issues, teams can intervene earlier rather than react after problems occur.
Prescriptive Analytics: What Should We Do About It?
Prescriptive analytics moves beyond analysis and suggests actions based on insights. Such as:
- Highlighting claims that require immediate follow-up
- Prioritizing denials with the highest financial impact
- Recommending workflow changes to reduce recurring errors
For example, prescriptive analytics may recommend prioritizing appeals for high-value denied claims while suggesting workflow adjustments, such as updating authorization checks or coding guidelines, to prevent similar denials in the future.
This type of analytics helps transform data into operational decisions, allowing revenue cycle teams to focus their efforts where they will have the greatest impact.
Key Revenue Cycle Metrics Every Healthcare Team Should Track
Revenue cycle analytics becomes meaningful only when teams track the right metrics. While healthcare organizations collect large volumes of data, not all metrics provide actionable insight. The goal is to focus on indicators that reveal where revenue leakage occurs and where operational improvements can have the greatest impact.
These metrics are especially critical when implementing revenue cycle analytics for medical practice, where even small inefficiencies directly affect profitability.
Below are some of the most important healthcare revenue cycle analytics metrics grouped by workflow area.
Coding and Documentation Metrics
Coding accuracy directly affects reimbursement outcomes. Small documentation gaps or coding inconsistencies can lead to repeated denials or underpayments.
Key metrics include:
- Coding accuracy rate: Measures how often codes align with documentation and payer guidelines.
- Documentation completeness: Identifies missing clinical details that may lead to medical necessity denials.
- Audit findings or correction rates: Highlights recurring issues that require training or workflow adjustments.
Tracking these metrics helps coders identify patterns and reduce preventable errors early in the process.
Billing and Claims Submission Metrics
Billing performance determines how quickly claims move through payer review. Important metrics include:
- Clean claim rate: Percentage of claims accepted without edits or rework.
- First-pass claim acceptance rate: Indicates how often claims are processed successfully on initial submission.
- Claim submission lag time: Measures delays between service delivery and claim submission.
Improving these metrics reduces delays and improves overall reimbursement timelines.
Denial Management Metrics
Denials often represent the most visible form of revenue leakage. Analytics helps teams move beyond individual claim review to understand broader patterns. Key denial-related metrics include:
- Denial rate by payer
- Top denial reason codes (CARCs)
- Appeal success rate
- Average time to resolve denied claims
These insights allow denial managers to focus on root causes rather than repeatedly correcting similar issues.
Financial Performance Metrics
Financial metrics provide a high-level view of revenue cycle health and cash flow efficiency. These financial indicators play a central role in healthcare financial management, helping organizations evaluate performance beyond surface-level reporting.
Common metrics include:
- Days in Accounts Receivable (A/R): Indicates how quickly payments are collected.
- Net collection rate: Measures how much of the expected reimbursement is actually collected.
- Cost to collect: Evaluates operational efficiency.
- Underpayment rate: The rate at which discrepancies exist between expected and received payments.
Step-by-Step Process of Revenue Cycle Analysis
Revenue cycle analytics is most effective when it follows a structured process. Here's what the step-by-step process entails:
Step 1: Collect Data Across the Revenue Cycle
The first step is to gather data from multiple sources throughout the revenue cycle. This includes claims submission data, electronic remittance advice (ERA) information, denial codes, coding and documentation records, and payment details.
Because revenue leakage can occur at any stage, combining information from different systems helps teams gain a more complete view of performance and identify issues that may otherwise remain hidden.
Recommended reading: How to Interpret an Electronic Remittance Advice (ERA) in Medical Billing
Step 2: Standardize and Normalize Data
Once data is collected, it must be standardized so meaningful comparisons can be made. Different payers use different formats, adjustment codes, and reporting structures, which can make analysis difficult without normalization.
Aligning denial categories, consolidating payer-specific formats, and organizing data into a unified structure allows teams to analyze trends consistently across workflows.
Step 3: Identify Patterns and Root Causes
With structured data in place, analytics helps uncover patterns that are difficult to detect through manual claim review. Teams can identify recurring reasons for denial, underpayment trends linked to specific payers, or workflow bottlenecks that slow reimbursement.
This shift from individual claim analysis to pattern recognition allows organizations to address systemic issues rather than repeatedly solving the same problems.
Step 4: Prioritize High-Impact Opportunities
Not every identified issue requires immediate attention. Revenue cycle analytics enables teams to evaluate which problems have the greatest financial or operational impact.
By focusing on high-value denied claims, frequently occurring denial categories, or cash-flow delays, organizations can allocate resources more effectively and achieve faster improvements.
Step 5: Implement Process Improvements
The next step involves translating insights into action. This may include updating coding workflows, improving documentation practices, refining claim submission processes, or introducing targeted training based on recurring denial patterns.
Implementing changes based on data-driven insights helps reduce repeat errors and strengthen overall revenue cycle performance.
Step 6: Monitor Performance and Refine Strategy
Revenue cycle analytics is an ongoing process rather than a one-time project. Continuous monitoring allows teams to track whether improvements are delivering measurable results and identify new trends as payer behavior or operational needs change.
Over time, this iterative approach helps organizations maintain consistent performance and prevent revenue leakage from returning.
How AI-Powered Revenue Cycle Analytics Helps Reduce Revenue Leakage
A revenue cycle analytics platform becomes significantly more effective when organizations can move beyond manual reporting and fragmented data sources.
CombineHealth’s AI analytics solution, Taylor, helps revenue cycle teams monitor performance, track key metrics, and turn complex data into actionable insight without adding new workflow complexity.
Bringing Data Together Into a Unified View
One of the biggest challenges in healthcare revenue cycle management is data fragmentation. Information from coding systems, billing platforms, payer responses, and denial tracking tools often exists in separate silos.
Taylor aggregates data across these sources and organizes it into a unified analytics view. This allows teams to see performance trends across the entire revenue cycle instead of analyzing isolated data points.
Monitoring KPIs and Revenue Cycle Performance
Taylor is designed to help RCM teams track performance continuously by monitoring key revenue cycle metrics and trends. Instead of relying on static dashboards or manual reporting, teams gain real-time visibility into operational performance and financial risk areas.
This allows coders, billers, and denial managers to identify inefficiencies and prioritize improvement efforts more effectively.
Turning ERA and Denial Data Into Actionable Insights
Rather than simply presenting reports, Taylor analyzes patterns across claims, denials, and payment outcomes. Mapping payer-specific denial codes into standardized categories makes it easier to identify recurring issues and compare performance across payers.
Billing and denial teams can quickly understand which denial reasons appear most frequently, where underpayments occur, and which workflows require improvement.
Prioritizing High-Impact Opportunities
By analyzing patterns across claims, ERAs, and denial outcomes, Taylor highlights recurring issues, including underpayment risks, denial patterns, and workflow bottlenecks. This helps teams focus their efforts on areas that drive measurable improvement instead of reviewing every claim manually.
Supporting Continuous Improvement
Revenue cycle optimization is an ongoing process. Continuous improvement is a core component of effective revenue cycle management, especially as payer rules and reimbursement models evolve.
Taylor tracks performance trends over time, allowing organizations to measure whether workflow changes reduce denials, improve clean claim rates, and accelerate reimbursement timelines. This continuous visibility supports proactive decision-making and helps prevent recurring revenue leakage.
By combining automated analysis with clear operational insights, Taylor helps healthcare organizations move from reactive claim management to a data-driven approach to revenue cycle improvement.
Take the Next Step Toward Smarter Revenue Cycle Insights
Revenue cycle analytics provides the insights needed to improve financial performance, but manually managing complex data slows progress. Implementing a scalable revenue cycle analytics platform helps healthcare organizations standardize reporting, monitor trends in real time, and reduce hidden financial risk.
AI-powered analytics helps teams move beyond static reporting by turning complex revenue cycle data into clear, actionable insights. With better visibility into denial patterns, payer behavior, and workflow performance, organizations can reduce preventable revenue leakage and make more informed decisions. This level of visibility is especially valuable for healthcare providers navigating complex reimbursement environments.
CombineHealth’s AI analytics solution, Taylor, integrates revenue cycle data, highlights denial patterns, and helps teams focus on changes that improve performance.
Explore how CombineHealth can help you turn revenue cycle data into actionable insights.
FAQs
1. What is revenue cycle analytics in healthcare?
Revenue cycle analytics in healthcare analyzes billing, coding, denial, and payment data to identify performance gaps, improve reimbursement, and reduce revenue leakage.
2. How is revenue cycle analytics different from reporting?
Reporting shows what happened. Analytics explains why it happened and helps teams decide what actions to take next.
3. What metrics are most important in revenue cycle analytics?
Key metrics include denial rates, clean claim rate, days in A/R, net collection rate, and payer-specific performance trends.
4. Can revenue cycle analytics reduce claim denials?
Yes. By identifying recurring denial patterns and root causes, analytics helps teams fix issues proactively and prevent repeat errors.
5. Who benefits most from revenue cycle analytics?
Medical coders, billers, denial managers, and revenue cycle leaders benefit by gaining visibility into performance trends and workflow bottlenecks.